In today's data-driven world, organisations aim to gather, process, and use data for strategic decision-making. Globally, more than 2.5 quintillion bytes of data is created every day, and 90 percent of all the data in the world was generated in the last couple of years (Forbes). There's a need for quick data collection to keep up with changing markets and consumer behaviours, providing a competitive edge by enabling companies to respond swiftly to trends and opportunities.
However, the accuracy and quality of the data are paramount. Inaccurate or low-quality data can lead to poor decisions, operational inefficiencies, and missed opportunities. Data issues can propagate throughout the analytics pipeline, causing a domino effect which may require extensive data cleaning, re-fielding, and increased time to derive meaningful insights. The challenge is finding the right balance between fast data collection and high-quality data.
Why is this problem difficult to solve?
Trade-offs: The challenge lies in the inherent trade-offs between speed and quality. Faster data collection methods can compromise data accuracy.
Resource constraints: A robust data collection, processing and visualisation platform requires substantial resources in terms of effort and budget which may not be available always.
Data complexity: Certain industries, especially financial services, demand a high degree of accuracy due to complex and sensitive data. Even a small error can have significant consequences.
Why is it important to solve this problem?
![]() Effective decision-making: Good data quality is key for better decision-making.
Effective decision-making: Good data quality is key for better decision-making.
![]() Operational efficiency: Accurate data saves time and effort by minimising data cleaning and validation.
Operational efficiency: Accurate data saves time and effort by minimising data cleaning and validation.
![]() Competitive advantage: Balancing data speed and quality helps organisations make informed decisions quickly, giving them a competitive edge.
Competitive advantage: Balancing data speed and quality helps organisations make informed decisions quickly, giving them a competitive edge.
Our client’s challenge
The client, a multinational financial services corporation with $4 trillion assets under management, have been running an annual benchmarking programme for 10 years, gathering data from over 1400 financial and investment advisory firms. But their current data collection solution had several problems; from data collection to the ease of usage for both the respondents and the survey administrators. Additionally, there were issues with data quality due to improper implementation of response validations, a user interface that was not user-friendly which reduced participation rates, and delays in publishing results.
The solution
Our client required a robust, user friendly and efficient data collection solution that would provide quick insights while ensuring data quality. They sought an error-free data collection platform and wanted to minimize human involvement in the data processing phase.

With the right balance of consultative and product focused approach, a solution was designed addressing both end-to-end survey management and insights journey. First, a thorough study of the questionnaire, data validations and interdependent questions was done to ensure a complete understanding on the data front. Having understood the client pain points, it was necessary to conceptualise a solution which would offer the clients the below advantages:
- User-friendly platform for both respondents and administrators
- Highly adaptable to accommodate any modifications requested by administrators
- The option to invite respondents out of sequence for added flexibility
- Capability to automate the end-to-end survey process
- 100% data collection accuracy
- Ensuring sufficient redundancies to prevent data loss during fieldwork
- Instant extraction and sharing of collected data in the desired format as needed
- Shortened timeframes for reporting the gathered data
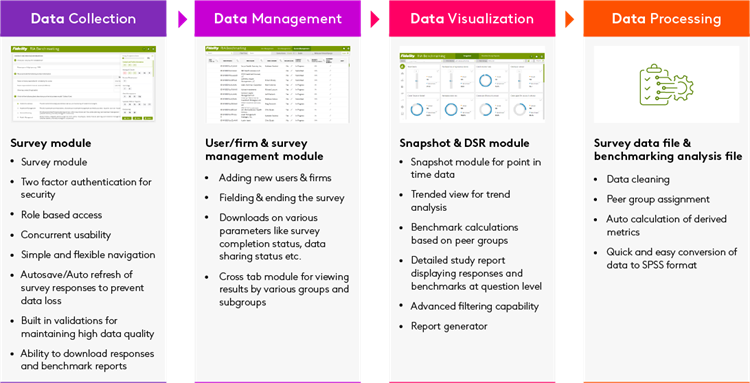
The result was an agile solution, ensuring a hassle-free experience to survey respondents as well as the survey administrators from data collection to visualisation allowing faster insight generation.
Seamless flow from survey to publishing results

The Impact
The survey was extremely fast to market vs competition. The numerous in-built validations improved data quality, reducing data processing time by 50% and improving the user experience by publishing results at a pace comparable to a self-serve BI tool (< 2 weeks). Additionally, it empowered all client stakeholders to customise the survey resulting in a 12% survey participation increase and overall completion rates rising by 18% in 2023.

Conclusion
This was the first of its kind integrated survey and reporting platform created at Kantar and serving the client for the past 2 years. With its advanced features like on demand survey and automated data flow and a roadmap for further enhancements in the upcoming year, this solution has exceeded the expectations of the client thus establishing Kantar as a strategic business partner.
Want to learn more? Contact us.


