India’s neo-middle class is a powerhouse of global economic activity, too. According to current projections, the middle class is expected to reach 41% of the country’s citiznry by 2031. As this class of affluent consumers expands, brands can expect massive surges in consumption.
India’s rapid evolution of economics, demographics and technographics, coupled with its sheer size, make it a prime candidate-market requiring regular adjustments in its socioeconomic classification. That is key for the market research industry to ensure sample selection, targeting and representivity remain relevant.
However, the challenge lies in understanding what makes these consumers tick. Market researchers are struggling to find online survey respondents who belong to India’s neo-middle class. Here’s why.
India isn’t as connected as we think
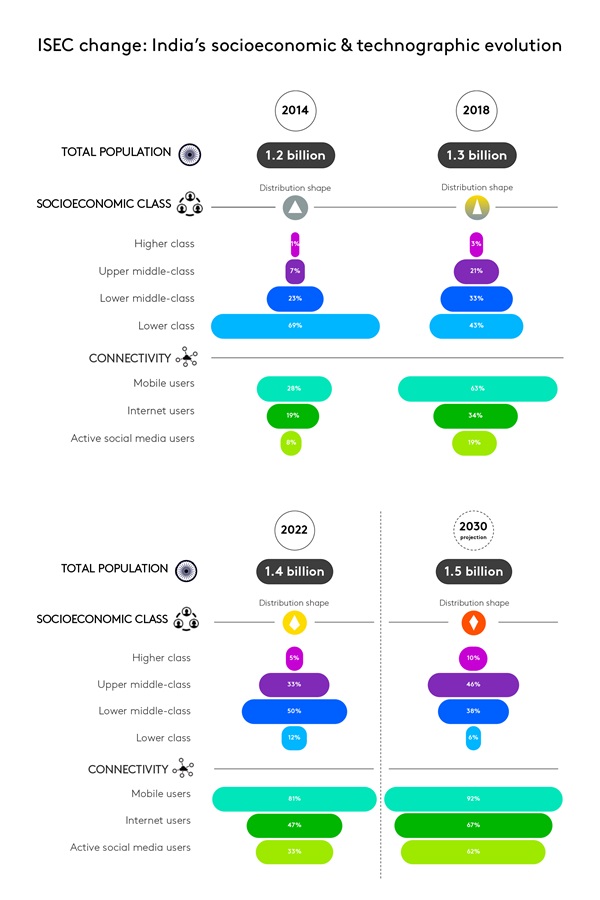
At the start of 2023, there were an estimated 1.10 billion active mobile connections in India. However, it can be a deceptive metric to measure the true active online universe.
Looking at internet users gives a slightly better indication. There were around 692 million internet users in India in 2023, approximately 48.7% of the total population. Focusing on active social media users further reduces the figure to 467 million, or roughly a third of the total population.
Following the logic above, we estimate that the true targetable online market research responder universe is only about 20-25% of the whole population.
In addition to this, there are other demographic biases of the online population, including (but not limited to!):
Gender: We know from major social media platforms that their user base is strongly skewed to males: 65% (YouTube) to 73% (Meta).
Age: There is a major bias to the younger population, with 75% of 18-35 years olds being active users and a majority of 36-45 years old not using social media regularly. This wide off-to-online representivity gap is a significant challenge for businesses to target off-the-grid customer segments.
India’s current socioeconomic classification system is flawed
India’s SEC (Socio Economic Classification) was developed in the mid-1980s to understand market segments and consumer behaviours.
With India’s rapid pace of demographic change, it has lost most of its meaning in the 2000s.
In 2010, the Indian government introduced the New Consumer Classification System (NCCS) based on education of the chief earner and a grid listing the number of durables owned by the household, including:
- electricity,
- ceiling fans,
- LPG stoves,
- refrigerators,
- washing machines,
- personal computers,
- cars,
- and agricultural land.
In the early 2010s, the NCCS was relatively effective in representing the entire population. It circumvented income as a variable, and it did not make a direct link between occupation and income – contrary to the previous SEC approach.
But NCCS also had some flaws, one being that no item in the list of durables has priority over another. Owning a ceiling fan has as much weight as owning a car or a piece of agricultural land.
Consequently, by the late 2010s, NCCS had seen a substantial growth in the upper classes and significant shrinkage in the lowest ones.
Was NCCS ever relevant for online market research?
Regardless of location, online consumer panels were biased to consumers pre-disposed to have access to computers in the 2000s and mobile phones in the 2010s. Knowing this, NCCS was never a perfect fit for online market research.
In its quest towards stability of socio-economic segments definition, MRSI came up with a new framework – the Indian Socio-Economic Classification (ISEC).
Developed pre-COVID, ISEC uses two variables: education and occupation, but asks about the education of both the "best educated male" and "best educated female" in the household.
MRSI clearly states that, comparing ISEC to NCCS, ISEC is much more discriminatory and much less volatile. Two quintessential qualities when it comes a segmentation methodology.
Indian Socio-Economic Classification: a way forward
Kantar has analysed the demographics and technographics of the respondents in our proprietary panel, revealing significant differences in lower socio-economic segments. Note: this analysis ensured that representivity in age, gender and location is similar between NCCS-classified audiences and ISEC-classified audiences.
Simply rebasing our respondents from NCCS to ISEC, we see strong differences in lower segments. While responders self-qualifying as NCCS A roughly translate into ISEC High, responders self-classified as NCCS BCDE are in an overwhelming majority (90+%) falling into the ISEC Upper-middle and Middle segments.
We also did not witness major behavioural shifts in responders’ trends when it comes to key FMCG and tech categories for the higher socio-economic segment. In other words, the ISEC High segment behaves as the NCCS A audience does.
However, some behavioural shifts start to happen when looking at NCCS BCD data, uncovering the growing irrelevance of the NCCS approach online. Survey responders who claimed to belong to the NCCS CD segments are in fact mostly behaving like Bs and mostly self-classify as ISEC Middle.
Re-classifying into ISEC makes intuitive sense.
It is clear both from a profiling and a behavioural data perspective that ISEC is overall better representing socioeconomic segments in India today.
What now, in a post-COVID and online India?
ISEC has a clear, positive impact on representing socioeconomic classes, and it is more relevant in the long term. Five years have already passed since ISEC was vetted by MRSI. During this time, COVID has accelerated digital adoption in a way never seen before and online market research in India has boomed – making India a tier-1 market for online research in volumes, only outperformed by the US today.
It is high time to drop online-irrelevant metrics, such as durables owned by a household. It is pressing to adopt a better and more representative way socio-economic segmentation model both offline and online. Finally, it is crucial to remain inquisitive on socioeconomic matters and we shall continue to question the accuracy and relevancy of any segmentation approach in this ever-changing digital world.
Stay in-the-know:
To learn more about our work on global demographic data, reach out to us here.