Sales in China’s fast-moving consumer goods (FMCG) market in the first quarter of 2021 increased by 10.5% year on year, which is a 3.1% increase compared with the same period in 2019 (before the COVID-19 outbreak). The growth in the market mainly came from the southern region and online channels. The National Bureau of Statistics has also revealed that the year-on-year GDP growth was 18.3% for the first quarter of 2021. It can be concluded that, with the pandemic under effective control and the overall positive economic performance, China’s FMCG market has been recovering very well.
The out-of-home FMCG market grew rapidly (by 38.9% year on year) in the first quarter, with an increase of 0.4% compared to the same period in 2019. This indicates that China’s out-of-home consumption market has also seen a strong recovery. As a result of the increase in people’s outdoor activities, skin care and facial cosmetics categories quickly resumed their growth at a double-digit rate. Meanwhile, consumers are now choosing to cook less at home, which has led to a decline in some food categories like instant noodles and frozen products.
Modern trade grew 1.4%
Modern trade (including hypermarkets, supermarkets and convenience stores) has recovered and slightly increased by 1.4% compared to last year, but still decreased by 2.6% compared with the same period in 2019. Among them, the sales from small supermarkets and convenience stores increased steadily by 6.5% and 8.7% respectively. The value sales of hypermarkets saw a similar performance to last year, with a slight increase of 0.3%, while that of large supermarkets kept falling by 1.3% year on year. This implies that many consumers are still accustomed to buying fast-moving consumer goods near their homes and communities.

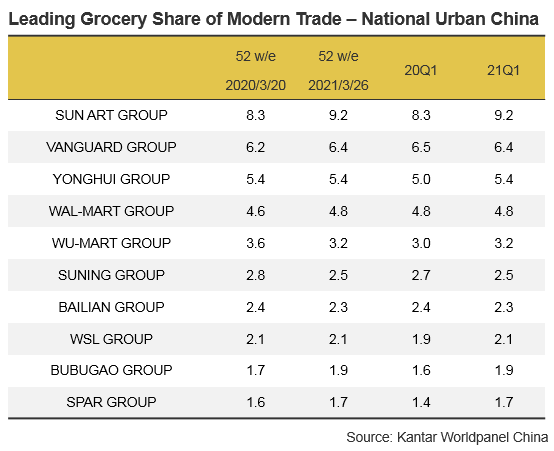
Among the top players, Sun Art Group maintained its first place with a market share of 9.2%, which increased by 0.9 points compared to last year, driven by both an increase in the number of consumers and the expansion of shopping baskets. In order to meet consumers’ digital and near-field shopping needs, Sun Art Group is investing heavily to set up its small and medium-sized stores and online to offline (O2O) channels as they continue to build their omnichannel presence.
It is noted that Wu-Mart Group has entered the top five retailers’ ranking in China for the first time, with its strong performance in the northern and western regions. The market share of Wu-Mart Group reached 3.2%, growing by 0.2 points year on year, which is likely attributed to its highly developed digital retail system, Dmall. The “Wu-Mart + Dmall” model has realised the integrated development of online and offline retailing, attracting more consumers who have strong purchasing power and want convenience.
For local retailers, both Better Life Group and SPAR Group performed well, achieving double-digit growth of their sales value compared to the same quarter last year. The growth of Better Life Group is mainly driven by the expansion of consumer shopping baskets with the help of its digital transformation. The growth of SPAR Group mainly comes from the outstanding performance of its corporate member Jiajiayue. In addition to cultivating the market in Shandong, Jiajiayue began a national expansion, accelerating the expansion of North and East China, and further improving the layout of the surrounding areas.
Ecommerce kept its strong growth
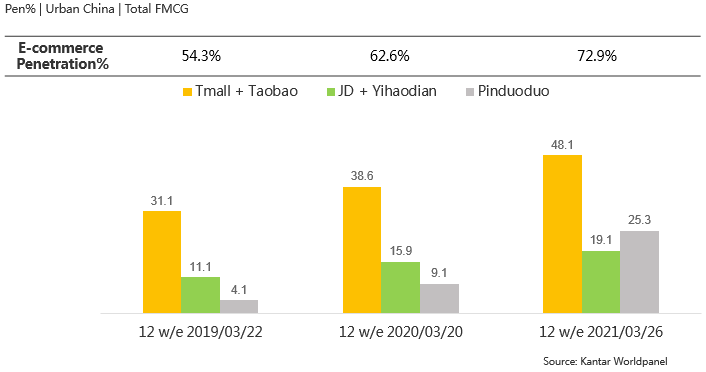
Online shopping channels maintained a strong growth, with an increase of 33.4% over the first quarter of 2020. Online shopping is still favoured by consumers even in the post-COVID-19 era, as it represents 22.8% of total FMCG value sales in China. The latest data reveals that ecommerce continues to attract new customers (especially in lower-tier cities with 10.7 points of the penetration growth, year on year), and is seeing people increasing their number of shopping trips, both of which drove the growth of online sales.

Among the top ecommerce platforms, Alibaba Group holds its leading position, with over 40% of the total online market value. Nearly half of Chinese urban households have purchased FMCG on Alibaba’s platforms during this quarter.
JD Group’s market share dropped slightly compared to last year, while Pinduoduo continues to see phenomenal growth, increasing its market share by 5.7 points and almost reaching 10% of the total share. In addition, there are more than a quarter of urban families (25.3%) who made at least one FMCG purchase on Pinduoduo in this quarter. It is worth noting that this number increased fivefold in the last two years, surpassing JD Group and directly driving its strong growth. We can see that Pinduoduo is growing particularly quickly in lower-tier cities, as its number of consumers in these cities has tripled compared to the same period last year. Their annual report shows that the number of active buyers reached 778.4 million by the end of 2020. Pinduoduo is now aiming to build a logistics infrastructure platform focusing on agriculture, where consumers can get fresher and healthier fresh food at lower prices.
Notes to editors:
Kantar Worldpanel China continuously measures household purchases over 100 product categories including cosmetics, food and beverages and the toiletry/household sector. Its national urban panel covers 20 provinces and four municipality cities (Beijing, Tianjin, Shanghai and Chongqing).
Kantar’s Worldpanel Out-of-Home Panel tracks 8,000 individuals covering Key and A cities.
Lower city tiers include prefecture level cities and county-level cities and counties.
Suning Group includes Carrefour and Suning CVS; Wumart Group includes Metro, Wumart, and New Century; Better Life Group includes BBG Department Stores, Nancheng Department Stores, and Jiarunduo.


