The latest Grocery Market Share figures from Kantar show total year-on-year sales increased by 2.0% during the 12 weeks to 21 April 2019. Bolstered by a record-breaking £2.5 billion spent during the Easter week, this is the fastest rate of growth the overall sector has experienced in 2019.
Shoppers indulged in £335 million worth of Easter eggs and seasonal chocolate during the 12 weeks and the average household took home 10 such treats during the longer build up from February to the holiday weekend. The warm weather over the Easter break helped boost sales of ice cream by 8% and hay fever remedies by 27% during the past four weeks as families made the most of the sunshine.
Growth of 8.6% pushed Lidl’s market share to a new high of 5.7%, up 0.3 percentage points compared with last year. Half of Lidl’s sales now come from the fresh and chilled aisles and its performance this period was fuelled by customers spending an extra £14 million on dairy items and £13 million on fruit, vegetables and salads. Fellow discounter Aldi was again the fastest growing supermarket, a position it has held since July 2018. Aided by its store-opening programme, Aldi attracted an additional 823,000 shoppers through its doors to grow sales by 11.6% and increase its market share by 0.6% percentage points to 7.9%.
Co-op and Ocado were the only other retailers to gain market share on last year, moving to 6.1% and 1.3% respectively. Co-op has been able to capitalise on periods of warmer weather as people shop closer to home and, with a 4.5% increase during the past 12 weeks, it has now grown sales continuously for a full year. Its ‘Irresistible’ range, especially crisps, snacks, biscuits and pizzas, proved particularly popular, up 11% on last year. The convenience retailer continues to perform well when it comes to small shopping baskets, accounting for 17% of all trips where people spend less than £20.
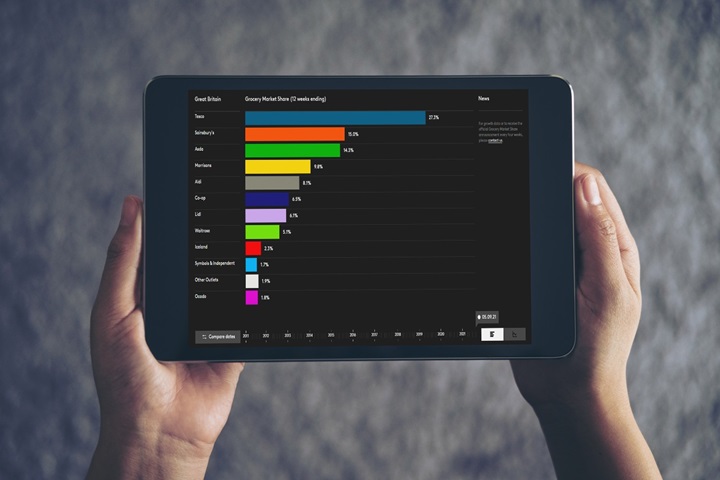
As the dust settles following last week’s CMA decision, Tesco’s position as the UK’s largest supermarket remains secure. More than three quarters of British households visited Tesco in the past 12 weeks, over five million more than each of its two closest rivals. Though sales were up 1.0%, growth was behind the market which meant a loss of share compared with last year to 27.3%.
Meanwhile, Sainsbury’s and Asda are continuing to battle it out for second place. Two thirds of the public were aware of the proposed merger: the majority of those who knew about the CMA ruling didn’t have an opinion as to whether it was a good or bad outcome, while only one third welcomed the decision.*
Sainsbury’s has reclaimed second position despite a sales decline of 1.2%. The supermarket achieved double-digit growth online which coincides with the launch of its first mobile-only payment store in central London this week, further demonstrating its drive towards digital innovation.
Asda increased sales by 0.3% to take market share of 15.2%. The average Asda shopping basket increased in value and shoppers visited more often. Asda remains strong in its northern heartland with the north of England and Scotland accounting for more than 40% of sales.
Despite movement at the top of the table, the phrase ‘big four’ continues to hold meaning and Morrisons’ 10.3% market share means it sits comfortably ahead of the fifth largest retailer, Aldi. Alcohol sales were the biggest contributor to Morrisons’ 0.6% growth this period.
Sales at Iceland and Waitrose rose by 1.4% and 0.7% respectively, with Iceland holding market share of 2.1% and Waitrose falling back by 0.1 percentage points to 5.0%.
Notes for editors
Please note that four week ending or six week ending retailer share data should not be used in media reporting. The 12 week ending data stated in this release covers a longer time period, which means it is a superior indicator of retailer performances and trends.
These findings are based on Worldpanel FMCG data for the 12 weeks to 21 April 2019. Kantar monitors the take home grocery purchasing habits of 30,000 demographically representative households across Great Britain. Kantar grocery market share data includes all expenditure through store tills, excluding petrol and in-store concessions. All data discussed in the above announcement is based on the value of items being bought by these consumers.
*Findings regarding attitudes to the proposed merger of Sainsbury’s and Asda are based on the responses of 21,765 adults (aged 18+) in Great Britain. The survey was conducted through the Shoppix app between Friday 26 and Monday 29 April by Worldpanel Plus.
For all publicly-quoted data, users of our research (including media) must ensure that data is sourced to ‘Kantar’.
Retailer growth figures reported by Kantar relate to overall take home sales, and so include the impact of store openings or closures. Like-for-like sales change is not measured or reported. Calculating like-for-like sales requires a detailed knowledge of store openings and extensions which is information held accurately only by individual retailers.
Kantar will only support data that is published in the context we have presented it and our own interpretation of these findings. Our commentary is based upon our own data and information in the public domain. We cannot be held responsible for any other interpretation of these findings.
An update on inflation:
Grocery inflation now stands at 1.4%† for the 12-week period ending 21 April 2019. Prices have been rising since the 12 weeks to 1 January 2017, following a period of grocery price deflation which ran for 30 consecutive periods from September 2014 to December 2016. Prices are rising fastest in markets such as cola, lamb and crisps, while falling in instant coffee, fresh sausages and nuts.
† This figure is based on over 75,000 identical products compared year-on-year in the proportions purchased by shoppers and therefore represents the most authoritative figure currently available. It is a ‘pure’ inflation measure in that shopping behaviour is held constant between the two comparison periods – shoppers are likely to achieve a lower personal inflation rate if they trade down or seek out more offers.