Apple's iOS delivered growth across major global markets during the first quarter of 2021, while Huawei's continued hemorrhaging of sales left Android struggling to keep up.
Our smartphone OS data for the first three months of 2021 show that the launch of the iPhone 12 during the fourth quarter of 2020 helped deliver year-on-year growth for iOS across the EU5 - France, Germany, Great Britain, Italy and Spain - (+3.6% points), the United States (+4.9% points), and Australia (+3.5% points). The greatest share growth came from Germany, rising 8.5 percentage points to reach a 29.8% sales share. Three iPhone models, the iPhone 11, iPhone 12 and iPhone Pro Max, claimed three of the top five selling models in the country. It was an impressive outcome, especially when compared to the same quarter a year ago when only the iPhone 11 was able to break into the top five.
iOS also demonstrated strong growth in U.S. with a 45.6% sales share, up 4.9 percentage points year on year. All Top 5 models sold are iPhone; iPhone 12, iPhone 11, iPhone SE (second generation) and the two iPhone 12 Pro models. This demonstrates the breadth of iPhone’s portfolio across price bands to broaden consumer appeal.
Despite challenges in Android’s overall performance during the first quarter of 2021, there is strong sales share growth among individual brands. Samsung year-on-year sales share is up in Great Britain (+4.7% points), Italy (+3.6% points), France (+2.3% points), and Spain (+1.6% points). Performance was supported by the launches of Galaxy S20 series in March 2020, followed by the launch of the Galaxy S21 series in January 2021. In Great Britain, Australia and the U.S. there are more Samsung premium/super premium tier models among the top 10 models sold than the same quarter in the previous year.
Chinese brands continue to perform well locally and in European markets; at least one in four smartphones sold in Italy are Xiaomi (up 4 percentage points year-on-year) and it is also 36.7% of smartphone sales in Spain, near flat performance year-on-year. Oppo continues to grow in China with 11% sales share (+2.7 percentage points year-on-year) and demonstrates its expansion into more markets reaching 5% of sales share in Spain, Italy and Japan.
In Japan, 57.4% of smartphones sold are Android (+6.2 percentage points year-on-year), with performance being driven by the launch of Sharp’s Aquos Sense 4 series. iPhone SE (second generation) still proves to be the most popular model; although having launched a year ago (April 2020) it will be interesting to see whether the position as the number one model sold will continue to hold.
So what device-specific features drive consumers to buy? We’ve long been talking about “screen size” (although still the case in France and Japan) and “quality of the camera” (although still the case in Germany) being the highest-ranking driver. However, there have been some shifts in the rankings with “Battery life” being the highest-ranking feature for buying smartphones in Australia, Great Britain, Italy, Spain and the U.S. More specifically, the growth of “battery life” as a driver across the EU5 is the “speed of charging” and in China the “length of battery life.”
While “camera quality” hasn’t grown as a reason year-on-year, it still ranks in the top three across the EU5 and Australia. More specifically, “Dual/Multi lens camera,” “Quality of the rear camera” and “Quality of photos in low light.” Unlike other markets, “Selfie camera” ranks higher in China than in other markets. In the U.S., “camera quality” moves from ranking third to fourth, overtaken by “Features of OS” (more specifically, the features of the OS that have grown year-on-year was “in built voice assistant” and “organizing apps/folders.” It appears the U.S. is not the only market to see an increase in the proportion of people buying for “Features of OS” with five other of the nine reported markets and narrowing in on these OS features “OS Cloud/Back up storage” sees an uptick in most markets. The ongoing buzz and rising availability of 5G-enabled smartphones/tariff plans continues to translate across all reported markets with a higher proportion of smartphones being purchased for its “5G Capability” vs. this time last year.
Thinking about the future purchasing outlook for the rest of the year, over the next six months between 13% to 20% of smartphone owners intend to purchase a smartphone; the lower share being France and the higher share being Italy. iPhone is the number one preferred brand in the U.S., Australia, Japan and Great Britain. In the EU5 markets, with the exception of Great Britain, Samsung is the most preferred brand and it’s Huawei in China.
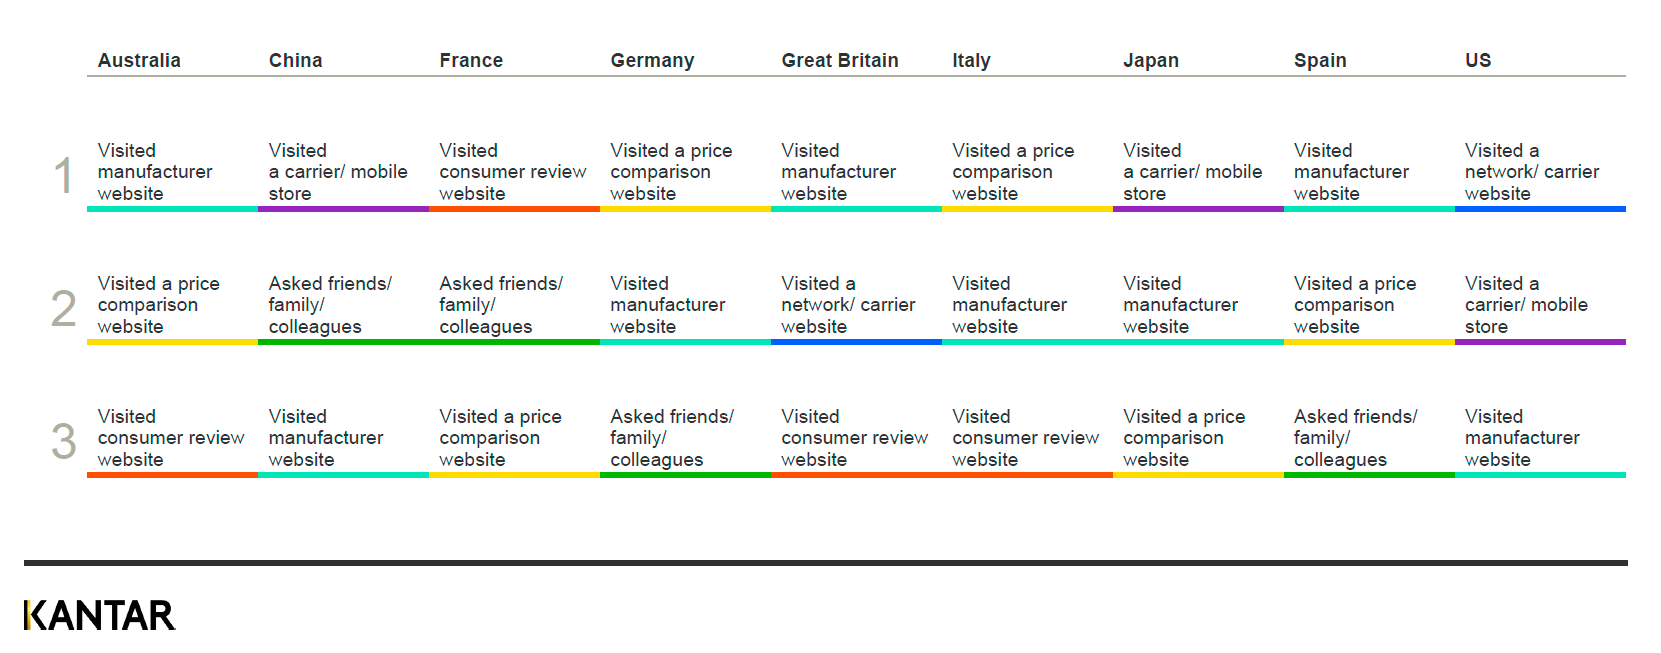
Manufacturers should be driving online as a means to build consumer touchpoints before they purchase. Consumers are researching online to prepare for their smartphone purchase. In all reported markets, except in France, consumers visit manufacturer websites to get information. The importance of cost is also demonstrated through the use of price comparison websites in six of the nine reported markets.
Network carriers are still important in the U.S., with purchasers using both website and in-store as a means to research. Finally, we cannot underestimate the influence of earned touch points with asking friends/customer reviews appearing in the top three pre-purchase research methods in seven of the nine markets reported.
Pre-Purchase Research, Top 3 Ranking
Check our data visualization tool to view and analyze smartphone OS market share data online. The latest sales share figures for the major operators can be viewed and compared with historical figures here.