There is no silver bullet to predicting election results, and it was never more apparent than in the 2024 US presidential election.
Numerous studies in neuroscience and psychology have shown how emotions influence voting. Functional magnetic resonance imaging (fMRI) studies of healthy participants have shown that the amygdala is involved not only in evaluations of trustworthiness from faces (Winston et al., 2002) but also in the evaluation of facial attractiveness (Winston et al., 2007) and other social traits (e.g., responsibility, intelligence and competence; Todorov & Engell, 2008). Further studies have shown that in actual electoral races, candidates with facial and vocal traits that are perceived as “competent” gain more voters (e.g., Berggren, Jordahl, & Poutvaara, 2010; Klofstad,2016; Laustsen, 2014; Olivola & Todorov, 2010; Todorov, Mandisodza, Goren, & Hall, 2005).
Emotions, measured using reaction-time techniques, are an accurate way to measure people’s intentions – be it a presidential race or brand selection. In addition to gauging response to stimuli (in this case, presidential candidates), the Intuitive Association technique goes a level deeper to measure how quickly, and hence how deeply rooted these associations are, providing an unfiltered view of people's feelings, leading to likely behaviors.
In both 2016 and 2020, Kantar Neuroscience leveraged the Intuitive Associations technique to accurately predict candidate sentiments, leading to more precise voter outcomes than regular polling estimates.
Our methodology and outcomes in 2016 and 2020
In 2016, 2020 and now in 2024, Kantar used the reaction-time technique to test people's sentiments towards the two presidential candidates.
Positive attributes: Confident, Competent (added in 2020), Intelligent, Trustworthy, Passionate, Caring, Visionary
Negative attributes: Arrogant, Secretive, Selfish, Corrupt, Foolish, Deceptive, Superficial
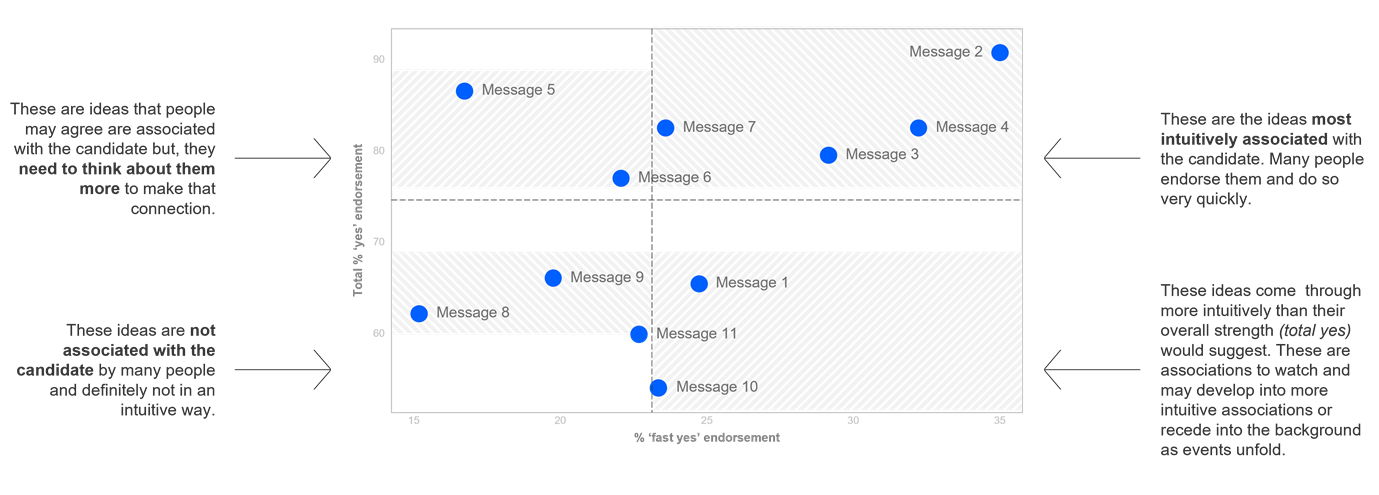
Candidate’s strengths and weakness were assessed by looking at the total percent of people who associated with the attribute (Total Yes – Y axis), as well as those who associated with the idea very quickly based on their reaction times (Fast Yes – X axis). The quadrant in Fig. 1 below highlights implicit strengths and weaknesses of the topic studied (in this case, 2016, 2020 and 2024 presidential candidates). The axes averages are the average of the study.
All responses on the right quadrant are more spontaneous responses, while on the left are more considered responses.
Quadrants allow us to compare Intuitive vs. Considered Associations around a topic:

In 2016, Trump had strong positive associations compared to Clinton; in 2020, Biden outperformed Trump. In both elections, the strength of voter sentiments was able to predict a clear winner.


Our learnings from the previous two elections showed that:
- Increased negative sentiments for a candidate motivates voters to vote against a candidate – as happened with Clinton in 2016 and Trump in 2020
- The more spontaneous positive emotions a candidate has, the higher the likelihood to win
- Competent rating was a particularly good predictor of voter preference based on learnings from academia as well as the 2020 election
Further looking at final voter outcomes, it was clear that people either overstate their intentions compared to what they are feeling or potentially do not reveal their true intentions. That’s the reason measuring feelings gives a good idea of predisposition towards a candidate.
2020 Competent Gap based on Intuitive Associations:
- Biden – Trump = 3.2%
- Actual Gap based on popular votes = 4.5%
- Survey based polls predicted gap by pollsters = 8-10%
The 2024 election in focus
Kantar’s Neuroscience Practice collected and interpreted implicit reactions to presidential candidates across 2053 US voters spread across two waves:
- Wave 1: September 25-October 22, 2024, Sample = 1103
- Wave 2: October 25-November 4, 2024, Sample = 950
Wave 1 Findings
We analyzed positive and negative emotions for each candidate. Wave 1 data for All Voters is discussed below.
Positive Emotions
- Candidates were statistically tied on Competent, a key predictor of historical election outcomes.
- With voters spontaneously considering Trump to be Intelligent, Competent and Prepared, his performance mirrored 2016 when he flipped the swing states and defeated Clinton. However, Harris was a stronger candidate compared to Clinton, with spontaneous associations on Caring and Intelligent.
Trump attributes of competent and intelligent move in the top right quadrant compared to 2020, reflecting a quad map that is similar to 2016.

Negative Emotions
However, Trump had many spontaneous negative associations, and Harris had no spontaneous negative associations compared to Clinton in 2016.
Based on studies in psychology Ingrid Haas, Director of the University of Nebraska’s Political Attitudes and Cognition Lab), negative reactions not only make it less likely someone will vote for a candidate but it can also motivate people to go out and vote against a candidate they dislike. This is most likely if the negative emotion in question is anger. Anger is a powerful motivating force, because it is a strong negative emotion and leads to what psychologist's call “approach behavior,” going out and taking action.*
Trump’s negative perceptions remain strong but are a bit less spontaneous than in 2020; Harris does not have the same spontaneous negative perceptions like Clinton did in 2016.

With statistically tied Competent perceptions, and unique positive strengths for each candidate, it was a challenge to predict outcomes. While the lack of negative sentiments seemed to give Harris an edge, there was still a chance that Trump could pull through given that his positive associations mirrored 2016. Clearly a lot depended on the swing states.
Wave 2 Findings
Consistent with multiple polls which gave Harris an edge close to election day, our Wave 2 data also showed sentiments leaning towards Harris.
Wave 2 sees more spontaneous positive sentiments towards Harris. On competence, Harris is directionally higher (55%) than Trump (51% at 90% confidence at a considered level.

Based on previous years, cumulative assessment of voter sentiments was seen to be a more precise predictor of voter outcomes – as such, we repeated this again in 2024.
Combining Wave 1 and Wave 2, we saw Harris was spontaneously considered Intelligent and Caring, while Trump was mainly considered Intelligent and borderline Competent. Harris’ 1-point lead was not significant.

With early Kantar polling predicting fewer negative sentiments for Harris and a surge in positive emotions for her on election eve, in isolation the two polling waves predicted a lean towards Harris; though both candidates remained tied on Competent, across both waves.
Clearly this election was not easy to predict, and deeper analysis was required.
Diving deeper
Since Competent on its own was not a discriminating factor between the two candidates, we explored if a more aggregated view of positive and negative emotions could help explain outcomes. As such, we looked at:
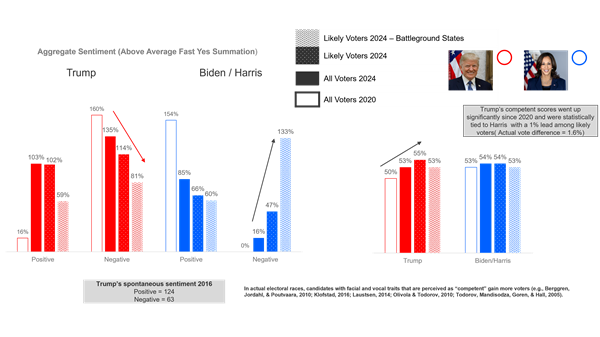
- Summation of All Feelings = Sum of Fast Yes for all attributes. While Competent is a good discriminator of voting preference, this represents all feelings faster or slower than the average.
- Summation of All Spontaneous Feelings = Sum of Fast Yes above the overall average for all respondents. This represents more spontaneous feelings that come to mind instantly and are faster than the average.
We further focused on analyzing these aggregated emotions:
- Trending previous election data to emphasize that Trump was the common factor across all three elections
- Difference between All Voters and Likely Voters to glean if voters more inclined to action had a stronger opinion on either candidate
- Battleground states to analyze if Trump had managed to flip these states again
- Issues important to voters and the candidate considered Competent to address those issues
- Trending: Trending 2016, 2020 and 2024 data revealed Trump had improved his Competent rating and his negative perceptions declined. Harris was seen as less positive than Biden and also had more spontaneous negative perceptions than Biden.
- Likely Voters Analysis: Likely voters behaved differently than all voters, revealing that Trump was favored more among this group, including spontaneous positive attributes of Intelligent and Competent. This analysis also revealed that Trump had an even higher Competent rating than he did in 2020.
- In battleground states, Likely Voters perceived both candidates to be equally positive, however, Harris had a strong negative perception compared to Trump indicating people chose the person who was less negative.
Trump’s positive emotions increased compared to 2020 and negative emotions declined. Among likely voters, especially in battleground states, both candidates were equally positive. The higher negative sentiments for Harris tilted the votes in Trump’s favor.

Why were Likely voters more inclined towards Trump?
Voters who felt any positive emotion for Trump were more motivated to come out and vote compared to those who felt any positive emotion towards Harris. In the end, while Trump’s negative perceptions were strong overall, they had reduced compared to 2020 and people felt more strongly about Trump to go and vote as compared to Harris.

Likely voters leaned Trump across different demographic groups including Younger Voters, Hispanics, Women and Independents.
Likely Voters’ negative response to Trump was lower while positive remained the same compared to All Voters. Harris’s positive response dropped while overall negative perceptions remained the same.

Who were the unlikely voters?
Younger, White, Democrat women who are single, don’t have a college degree or young kids and are religiously unaffiliated were among the least likely to vote.

What were the candidates’ perception on issues that were important to voters?
Importance of Issues: The analysis of important issues to voters showed that Trump had a significant advantage on Competent over Harris on issues most important to Likely Voters – the economy, inflation, jobs and immigration.
Likely Voters were motivated by Trump’s significantly higher competence levels on the issues they deemed most important – the economy and inflation, as well as jobs and immigration.

Harris’ perceptions on Competent stemmed from issues that were Different, but Trump was seen to be Competent on issues more Meaningful to voters.
Summary
In 2024, despite the two candidates being statistically tied on Competent, it remained a strong predictor of voter behavior. Trump was more spontaneously associated with Competent (+1.9% Fast Yes vs. Harris) and was above the average line.
2024 Competent Gap based on Intuitive Associations (Total Yes %) among Likely Voters:
- Trump – Harris = 1.2%
- Actual Gap based on popular votes = 1.5%
- Survey based polls predicted gap by pollsters = 2% in favor of Harris
Kantar’s 2024 elections analysis reiterated the strength of using Intuitive Associations to predict outcomes. When strength of association on the key attribute (Competent) is statistically tied, aggregate analysis, trending over time, as well as understanding segments (in this case likely voters and battleground states) and performance on issues that mattered the most to voters can deepen our understanding of voter motivations and help us to more reliably predict voter behavior.


